This morning my colleague told me that our website was taking a lot of time to load, like 30 seconds. This is abnormal, seems urgent so I took a look.
I opened the website in my browser, and indeed, the page took a lot of time to finish rendering. This is unacceptable UX. My first action was to open the network requests tab.
This is what I found:
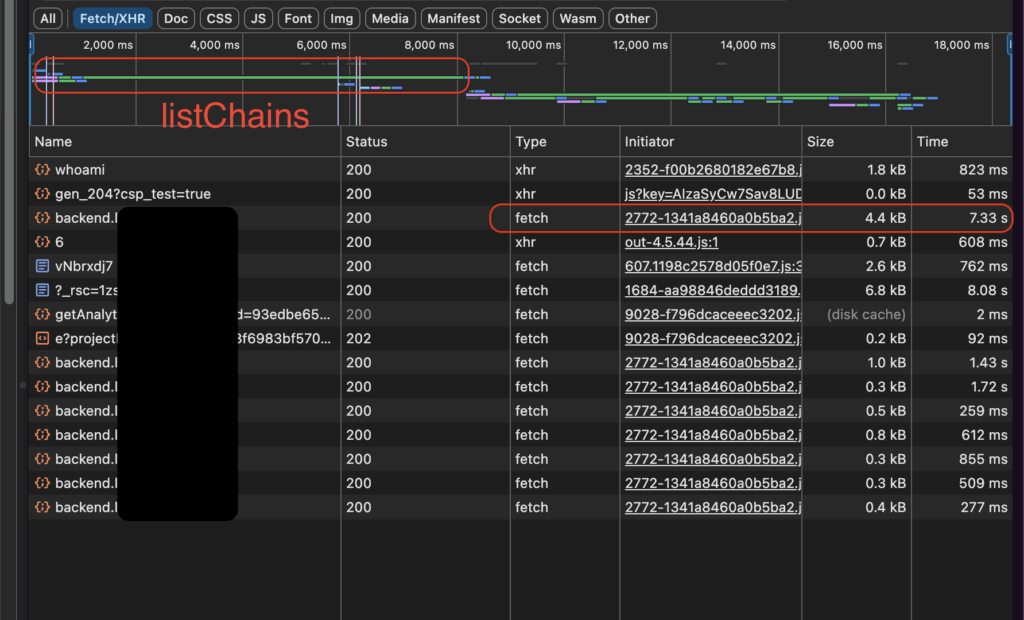
There is an API called listChains, which normally only takes hundred of ms to load, now took more than 7 seconds. This is an important API which must be returned so that other things can load (explained our FE team). I tried reload the page several times, same thing happened.
Instead of keep reloading the page, I exported the request as cURL to run in a terminal. Surprisingly, thy same f*king request took only 0.3 second to finish on my terminal. That’s weird!
First thought
With a face that couldn’t look more stupid, I asked myself: what just happened? I tried running the request several more times in the terminal, but all the responses were quick.
Logically speaking, there must be some different between when the request was running in the browser and running in cURL format. I asked ChatGPT, but it replied with no helpful response:
- your browser might be running with HTTP/2 while
curlruns HTTP/1 - there is a custom logic in your backend that treats HTTP agents differently
- there might be headers that the exported cURL doesn’t have
- blabla…
Honestly, those above reasons still make sense, but I know that there is no custom logic in the backend, nor any header difference. I must have skipped something important.
What if the web app is the cause? Our web app is written in NextJs, may be the FE guys were doing some nasty stuffs there (turned out it’s not true, sorry guys).
GraphQL playground
I opened the GraphQL playground and performed the same listChains request. The response was also slow as hell. OK, so it’s not web app. It’s definitely some difference between cURL and browser request that I couldn’t find out.
Take a look at the backend server
Clueless of what was happening, I went to Grafana and looked at the backend server metrics.
Backend CPUs are under high load!
But wait, that doesn’t explain why the cURL requests are still being promptly returned, while the browser requests are slow. And if the backend CPUs are under high pressure, why is only listChains affected? Or is it?
GraphQL playground again
I perform an other request using the playground: getMe
The getMe API performs somewhat the same as listChains, it does nothing but returns the current user info, getting from database without any table join or external service call. This API exposes many returning fields, so I projected only some of them.
The response was quick.
Trying adding more fields, one by one, the response was somewhat slower, but not too slow, up until a point, the response was returned after 20 seconds. Eureka, that’s it!
But why is this particular field projection caused the slowness? It’s just a normal DB field!
Full of doubt, I tried toggling projection for an other field. Same thing happened, adding any more field to the current projection cause the slowness to happen. Aha, it’s not because of any particular field, it’s because of the size of the response payload!
The small detail
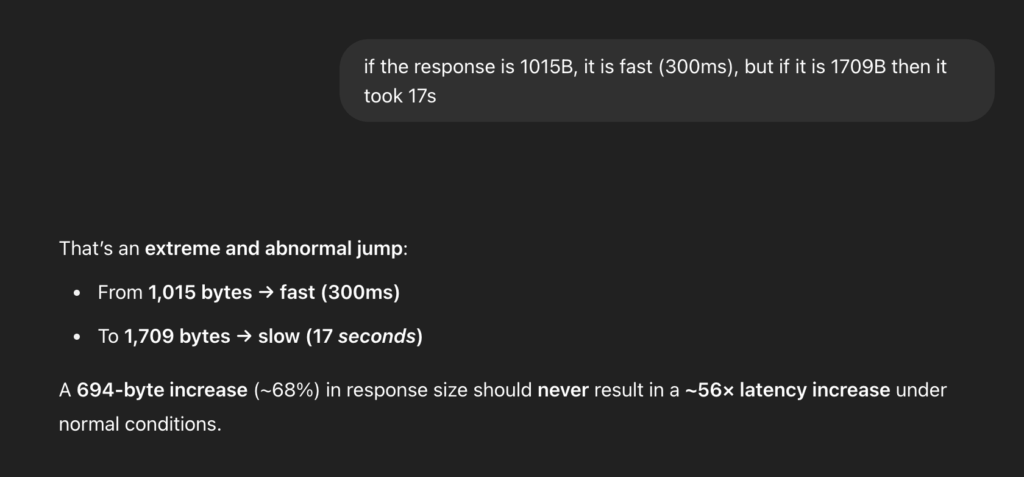
On the top-right of the GraphQL playground, there is a small label that displays the Content-Size of the response payload. I noticed that when the payload is 1015 bytes, the response was fast, but when they payload is just a bit more (because of the projection of the new field), the response was very slow again.
I asked GPT:
ChatGPT became helpful again: within its response, the word “compression” hit my eyes.
Compression costs CPU
We know that compression is an CPU-intense operation. Given the situation where our backend CPUs were under high-pressure, adding compression to the response payload definitely saturated the CPUs.
To confirm my guess, I asked GPT if cURL request asks for compression by default. It says: “no, unless you specify the --compressed flag”. Full of hope, I immediately fired a new request using cURL, this time with compress flag.
curl --compressed <the http request here>And… voilà. The response was returned after dozen of seconds.
Who did the compression?
The cURL request was indeed missing an important header: Accept-Encoding. This header is not exported from Chrome DevTool when I exported the browser request.
The Accept-Encoding header tells the server that the client is able to handle some kind of compression algorithms. If there is a match between the compression algorithms which the server supports and the algorithms which the clients can handle, the response will be compressed using that algorithm.
In our backend, we use koa-compress as the compression middleware. This middleware has default compression threshold as 1024 bytes, which means, when the response payload is larger than 1024 bytes, it will be compressed. That explains why my response at 1015 bytes was fast, because no compression was done, while the CPUs were already busy handling other requests.
The solution
After I and ChatGPT cheered at the root caused, it was time for solutions. Once the problem is clear, ChatGPT shows its excellence at providing solutions.
There are two main solutions:
- Off-load the compression to the CDN or proxy.
- Adjust the compression threshold.
As our backend servers are not behind any CDN or proxy, the first solution is not available. I went with the second solution. The koa-compress lib has option to adjust the threshold, which can be simply modified.
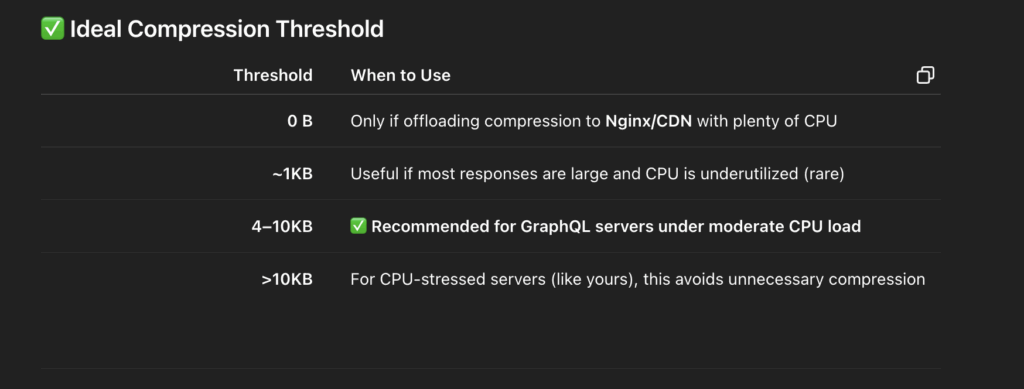
I set the threshold at 5KB. I trust you this time, GPT (also because I didn’t have much time and had to act quick).
This is of course not an ideal solution, I will still have to solve the high load issue (may be to autoscale our servers), but this workaround helped me recall a fundamental concept of HTTP model.
— end —
Leave a Reply